Menus
Main menu bar is located at the top of application window, right under the title bar.
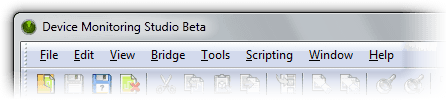
Main menu contains almost all commands implemented by the Device Monitoring Studio. It is structurally divided into the following groups:
- File
- Contains commands related to working with workspaces.
- Edit
- Contains all editing commands and Clipboard commands.
- View
- Contains the list of tool windows, commands to export/import tool window configuration or load a predefined configuration.
- Bridge
- Contains commands related to Serial Bridge.
- Tools
- Contains generic commands that control different tool windows, as well as a current monitoring session. The Tools » Settings… command is an entrance to the central place where you fine-tune the Device Monitoring Studio by changing different options.
- Scripting
- Contains scripting-related commands.
- Window
- Contains commands that manage the number and location of editor windows.
- Help
- Contains commands that can be used to access this documentation file, check for program updates, display keyboard map (a table of associated shortcuts) as well as display information about the Device Monitoring Studio.