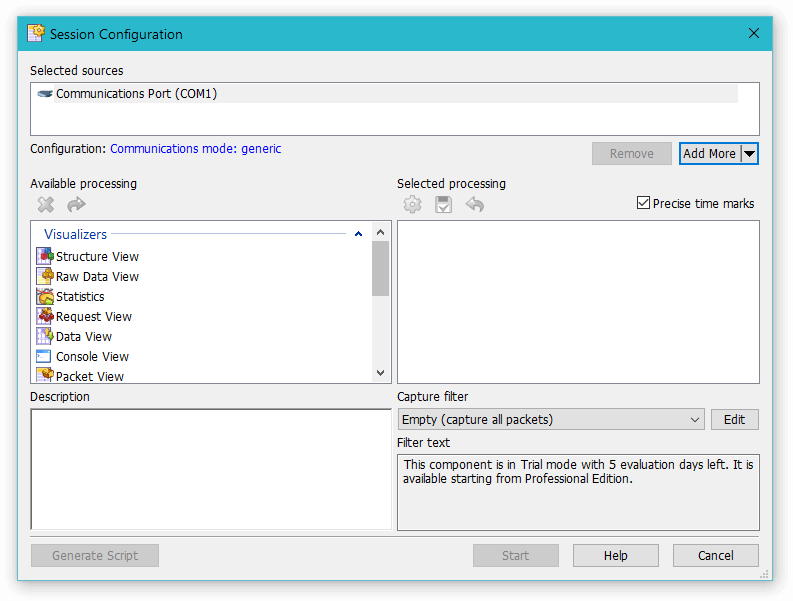
Session Configuration Window
This dialog allows you to specify configuration for new monitoring session or change configuration of the existing session.
Selected Sources
When you start configuring a new monitoring session by double-clicking on the device in Devices Tool Window, Session Configuration Window opens. It contains selected device in the Selected Sources list.
Device Monitoring Studio supports the so-called multi-source sessions, when two or more devices are included in the same session. The following device types support multi-source sessions:
- Network
- USB
- Serial
The following device types do not support multi-source sessions:
- Playback
- Remote (all types)
- Serial Bridge
If the current device type supports multi-source, Add More and Remove buttons appear. Clicking the Add More button brings up the list of other devices of the same type. Click on the device to add it to the session. Select the device and click the Remove button to remove it from the session.
Running sessions do not allow changing the list of devices. That means that if the Session Configuration Window is opened for a running session, these buttons will not be present.
Configuration
For some sessions, a session-wide device configuration is available. Serial, Playback, Serial Bridge sessions currently provide session-wide configuration. See corresponding sections for more information.
Time Measurement Mode
Device Monitoring Studio supports two time-measurement modes: standard and precise. In standard mode, system default timer is used to measure packet times. Its precision usually varies from 0.5 ms to 20 ms.
Precise mode tells the Device Monitoring Studio to use high-precision system timer, which precision is usually several microseconds. On some computers, using precise timer to monitor a high-baud rate session may decrease system performance. Precise mode is default for Windows 7 or later.
Available Processing
This list contains all installed modules that are available for a current session. Supported modules vary for different device types (USB, Serial or Network) and vary depending on whether the current session is multi-source session or not. Only a small subset of modules support multi-source sessions.
Device Monitoring Studio also allows the user to create customized “versions” of predefined data processing modules (see below). If user has created such customized modules, they are also presented in this list.
A data processing module belongs to one of two categories: visualizers and exporters. Visualizers always have a separate designated window to present the result of their work to the user in one or more formats. Exporters usually do not have a designated window and produce non-visible output (like writing to a file). Exporters often communicate with the user by means of Sessions Tool Window.
To add a data processing module to the session, either double-click it in the list, or select and press the Add to Session button. A single visualizer may be added multiple times to the session, while some exporters may prohibit this. Description pane provides a brief description for the selected processing module.
Favorites
Any processing module may be added to a Favorites list by right-clicking it in the list and selecting the “Add to Favorites” menu option. Favorites are always displayed at the top, allowing for quicker access to the selected processing module.
Selected Processing
Displays a list of data processing modules currently configured for the session.
Some of the modules support additional user configuration. These modules display an underlined comma-separated list of their current configuration settings next to their names. Clicking on this list brings up the Configure window, which allows the user to change default configuration. Alternatively, you may use the Configure Data Processing… button.
Note that this configuration is per-module and per-session. That is, if you add multiple Structure View visualizers to a session, you may configure them all with different settings.
Device Monitoring Studio allows you to save the specific configuration for later use. To save custom configuration, follow this procedure:
- Add required data processing to the session (see above).
- Click on processing's configuration and change it.
- Click the Save Custom Processing… button and specify the custom configuration name. Custom configuration appears in the Available Processing list.
You may now use this custom configuration when you create new monitoring session, for example.
NOTE
Some data processing modules may disallow changing their configuration if session is already running.
To remove data processing module from Selected Processing list, select it and press the Remove command.
Capture Filter
Allows you to select one of predefined capture filters for a session or create a new capture filter.
Scripting Support
Device Monitoring Studio has the Monitoring Object. It allows user scripts to create, configure and start monitoring sessions and provides full functionality of the Session Configuration Window to user scripts.
Pressing the Generate Script button will generate a new script file with script code that creates and initializes a monitoring session that matches the current configuration in Session Configuration Window.