Serial Data Source
This data source supports monitoring of traffic to or from any serial device, including legacy, PnP and virtual serial devices, connected to a local computer (or remote computer in case of Remote Source).
Serial Source extracts the serial device capabilities and presents them in Serial Device Information window.
It supports Capture Filter that allows the user to filter unneeded traffic.
Currently, the following data processing modules are supported for serial monitoring:
- Structure View (supports multi-source sessions)
- Raw Data View (supports multi-source sessions)
- Request View (supports multi-source sessions)
- Packet View (supports multi-source sessions)
- Statistics (supports multi-source sessions)
- Console View (supports multi-source sessions)
- Custom View (supports multi-source sessions)
- Data View
- MODBUS View
- Line View
- PPP View
- Data Recording
- Raw Exporter
- Text Exporter
Multi-Source Support
Serial data source fully supports multi-source sessions. Not all data processing modules support multi-source session (see the list above).
Protocol Definitions
Request View, Console View, Custom View, Structure View and Raw Data View data visualizers, as well as serial Capture Filter depend on protocol definitions installed with Device Monitoring Studio. Other data visualizers (“legacy” visualizers ported from the Device Monitoring Studio 6) do not depend on protocol definitions and therefore, do not support user-defined protocols.
These definitions are written using the Protocol Definition Language and are installed with a product in %INSTALLDIR%\protocols folder.
Device Monitoring Studio also allows the user to customize these definitions by adding new protocols or modifying existing ones.
Serial Session Configuration
Serial Source is somewhat different from other data sources. All data sources carefully capture packets originated in monitored application. In case of serial communications, monitored application often does not have a priori knowledge of the protocol and therefore cannot issue write (and especially read) requests of correct sizes. Monitored applications usually read a single packet in several requests or, sometimes, read several packets in a single request. This makes protocol binding and data analysis extremely difficult.
Device Monitoring Studio allows you to specify the so-called serial communication mode, also known as session type. By choosing communication mode, you give DMS a knowledge of the communication protocol and it starts searching for full protocol packets, or frames in the monitored data stream. It then reorganizes the data stream into correct sequence of read and write requests. When the new data stream reaches configured data visualizers and other data processors, they will deal with perfectly formatted frames, and provide accurate information themselves.
Currently, the following communication modes are supported:
- Generic
- No repackaging occurs. This is a default mode. Additionally, the user may specify if empty read packets should be discarded. This should be selected if monitored application uses active polling: issues a non-blocking read request that gets completed immediately even if there is no incoming data.
- PPP
- Serial Source searches for PPP (Point to Point Protocol) frames in the monitored data stream. In addition to separating the original data stream into individual PPP frames, it also provides character un-escaping.
- One packet in a line
- Includes a large set of ASCII protocols where each packet ends with a CR (0D) character, optionally followed by LF (0A) character. This includes such protocols as AT commands (modems), NMEA (GPS devices), MODBUS (ASCII mode) and so on.
- MODBUS (RTU mode)
- MODBUS RTU mode.
- MODBUS (ASCII mode)
- MODBUS ASCII mode.
- Custom communication mode
- This mode allows the user to specify custom rules for packet splitting and joining. Refer to the separate topic Custom Communication Mode for detailed information. If this option is grayed out, make sure Scripting feature is installed. PPP frames usually encapsulate a network protocols inside them. Using PPP communication mode and PPP View data visualizer, allows you to automatically decode them.
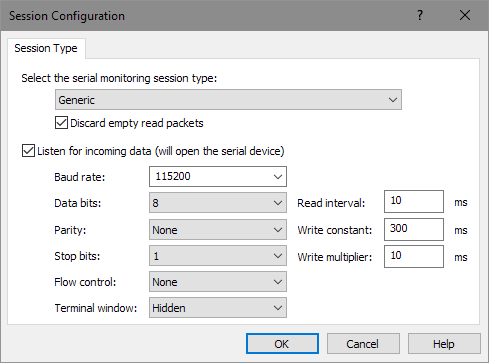
Listening Mode
Serial source integrates with Serial Terminal. You may have the serial monitoring session automatically start a terminal session for the selected device. Enable the “Listen for incoming data” option and configure the port parameters, such as baud rate, data bits, parity, stop bits and flow control.
If you intend to communicate with a device from the Device Monitoring Studio, make sure the “Terminal window” switch is set to “Visible”.