Playback Data Source
Playback Data Source allows you to play back the log files recorded using the Data Recording processing module. Playback never sends any data to any physical device; it only “mimics” the original device and allows the user to replicate the original monitored session. Log file playback is useful if session analysis is hard or impossible in real-time during actual device monitoring.
Device Monitoring Studio has two globally configured paths: path to log files and default path for playback. By default, these paths both point to the same folder and this is a recommended configuration. The user may change these paths on the Tools » Settings, Recording/Playback Tab.
Data Recording uses the log folder to store log files it creates. Playback Data Source scans the playback folder for log files and adds them to corresponding categories in Devices Tool Window. A Recorded Sessions category is created as a child of USB, Serial or Network categories, into which log files are added. For convenience, device log files are placed into the category named after the device.
Device Monitoring Studio automatically watches for changes in the playback folder and updates the tree accordingly.
Starting Playback
To start log file playback, select a log session in a tree and press the Start Monitoring… button or just double-click it.
A Data Source Configuration window opens that allows you to select the time range for playback as well as specify the playback speed.
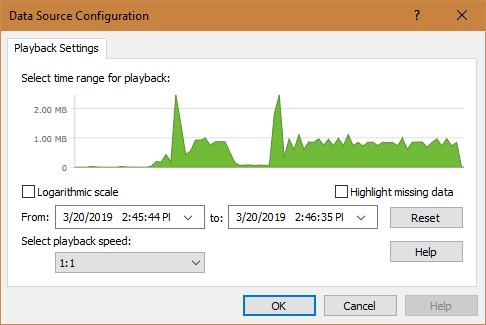
Use the From and To time selection fields to specify the required range, or use the mouse to select the range on the plot.
You may select playback speeds from 1:16 to 16:1, as well as two additional options: stepped and continuous. These addition options mean the following:
- Stepped
- Display only a single packet after which requires you to press the Next button on Device Monitoring Studio's status bar.
- Continuous
- Do not take original time delays between packets into account and displays the whole contents of the log file stream at once. Use this mode with care, as it may lock Device Monitoring Studio's user interface for some time.
Playback Controls
During playback, Device Monitoring Studio's status bar displays two progress bars and optional Next button. The first, longer progress bar displays the overall playback progress. If there is a significant delay between two consecutive packets, a second progress bar visualizes this delay. If you do not want to wait, click the Next button. In stepped playback speed mode, you must press the Next button after each packet.
Managing Log Files
You may use additional commands, available through the item context menu in Devices Tool Window to manage log files:
- Open File Location
- Open the log file's folder in Windows Explorer.
- Delete
- Delete the log file (AKA session) or all log files for the device.
- Sort by Date
- Sort all log file sessions by date of creation.
- Sort by Name
- Sort all log file sessions by their names.
- Display Date and Time
- Display session's date and time next to its name.
- Display Size
- Display session's size, in bytes, next to its name.
Working with Log Files from Other Locations
Although Device Monitoring Studio automatically detects and displays log files in default playback folder, you may easily play back a log file located in any other location. Just use the File » Open command, Drag&Drop or simply double-click the log file in Windows Explorer to open the file in Device Monitoring Studio and bring up the Session Configuration Window.