Structure View
Structure View data visualizer is a two-part window. First part displays each monitored packet parsed according to installed set of protocols. Second part displays raw packet contents. Changing the current position in one window automatically changes the position in another, provided the Tools » Raw Data View » Synchronize option is turned on.
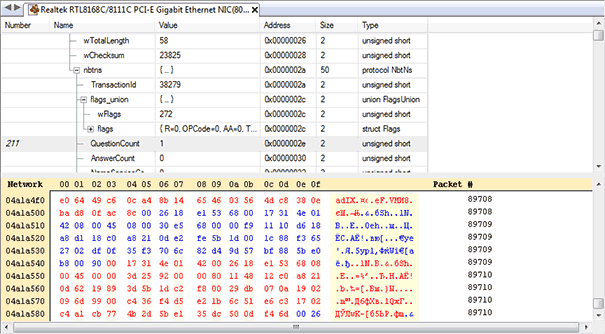
Decoded Packet Contents
Each packet is matched against one or more of loaded protocol definition files and if matched successfully, all protocol fields are shown in the top part of the Structure View visualizer. For each field, its name, value, starting offset and size are displayed. If field consists of other fields, you may expand it by pressing the little plus icon or using the Right Arrow key on the keyboard.
You may use mouse and keyboard to navigate to other fields within a current packet or to other packets.
If you bring up the context menu, the following commands are displayed:
- Copy Line
- Copies the currently selected line into the Clipboard.
- Copy Value
- Copy only field's value into the Clipboard.
- Expand Sub-Tree
- Expand the field's sub-tree.
- Collapse Sub-Tree
- Collapse the field's sub-tree.
- Next Packet
- Jump to the next packet.
- Previous Packet
- Jump to the previous packet.
- Go to Packet…
- Jump to the specified packet.
- Selected Packet Details…
- Display details for the selected packet (if Synchronize option is off).
- Set Filter…
- Set or modify the current display filter.
Raw Data View
See the Raw Data View visualizer section for description of the bottom part of the Structure View data visualizer.