Statistics
This visualizer collects and displays various data statistics on monitored stream. A list of counters depend on the session type.
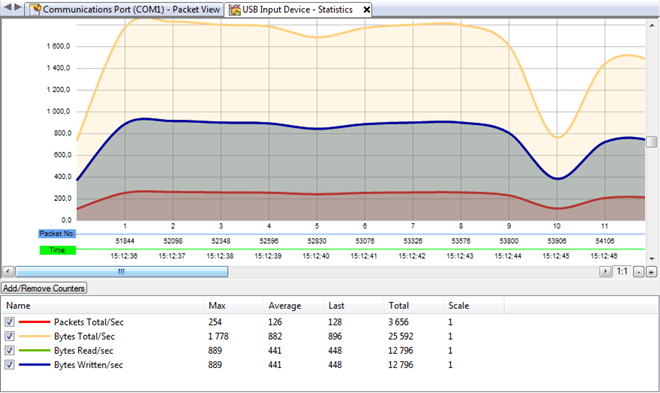
USB
- Packets Total/Sec
- Packets Read/Sec
- Packets Written/Sec
- Bytes Total/Sec
- Bytes Read/Sec
- Bytes Written/Sec
- Control: Bytes Total/Sec
- Control: Bytes Read/Sec
- Control: Bytes Written/Sec
- Bulk: Bytes Total/Sec
- Bulk: Bytes Read/Sec
- Bulk: Bytes Written/Sec
- Interrupt: Bytes Total/Sec
- Interrupt: Bytes Read/Sec
- Interrupt: Bytes Written/Sec
- Isochronous: Bytes Total/Sec
- Isochronous: Bytes Read/Sec
- Isochronous: Bytes Written/Sec
Serial
- Packets Total/Sec
- Bytes Total/Sec
- Bytes Read/Sec
- Bytes Written/Sec
- IO Packets/Sec
Network
- Packets/Sec
- Bytes Total/Sec
- Bytes Received/Sec
- Bytes Sent/Sec
By default, only some of these counters are displayed. To add more, click the Add/Remove Counter button.
Bottom part of the visualizer displays the variable statistics. For each variable, the following is displayed:
- Variable Name, line width and color, visibility flag. Click on the checkbox to toggle variable on or off.
- Maximum value
- Average value
- Last value
- Total
- Scale
You can toggle each variable visibility by clicking on the checkbox next to variable's name. You can also change the variable's color, line width and scale by double-clicking the variable to display the Variable Properties window.
Click anywhere on the plot area to place a check mark (a so-called Static Line). After you place a static line, you will see the momentary values for each variable at the top-right corner of the visualizer.
If you hold a Ctrl key while clicking on the plot area, you place a tracking line, which is bound to the data and does not move.
To remove either the static or the tracking line, click on the far right part of the plot area, just under the lines' informational area.
The visualizer displays three different kinds of data on the X-axis, sample number, packet number and time mark. You can use the Display sample indices on X-axis option on Tools » Settings, General Tab to toggle displaying the sample numbers on X-axis.