Raw Data View
The purpose of this data visualizer is to extract the raw data from packets and display it as contiguous data stream.
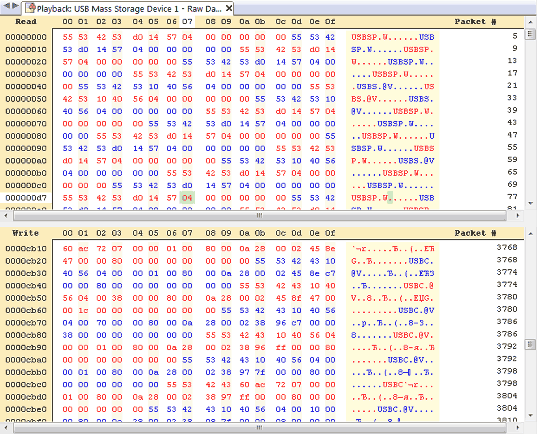
The visualizer is visually divided into two parts, where incoming data is displayed in the top part and outgoing data is displayed in the bottom part. You can use the mouse to adjust the size of both parts.
All incoming or outgoing data is grouped into the single stream. By default, each next packet has interlaced background color, allowing you to visually separate packets from one another. You can choose between three packet coloring modes using the Tools » Raw Data View » Packet Coloring command. There are “no coloring” mode, “odd/even” coloring mode and “read/write” coloring mode.
When you hover the mouse pointer over data in a stream, the following brief packet information is displayed:
Packet number.
Packet absolute time and difference from the previous packet.
NOTETime difference to the actual previous packet is displayed. This maybe an informational or control packet, or packet, which is actually displayed in another part (that is, outgoing or incoming packet).
Size of the whole packet.
Size of the data taken from the packet.
For USB, the endpoint information is displayed.
The cursor movement in both parts may be synchronized. After you enable the synchronization using the Tools » Raw Data View » Synchronize command, moving the cursor in one part automatically moves the cursor in another part. Device Monitoring Studio automatically locates the nearest packet.