Customization
The Raw Data View provides great customization options, which you may assign separately to incoming and outgoing parts.
- Display As
- You may configure data display as hexadecimal, decimal, octal or binary numbers. You can also treat data stream as floating-point numbers of either single or double precision.
- Group By
- You may group data in bytes, words, double words or quad words.
- Columns
- You may change the number of displayed columns. If you select “Auto”, the data stream will take all available window width.
- Code Pane
- Allows you to switch the code (left) pane on or off.
- Text Pane
- Allows you to switch the text (right) pane on or off.
- Endianness
- You may display data as little-endian or big-endian. Obviously, this will not affect data grouped in bytes.
- Encoding
- Change the text encoding in the text pane. More than 160 different encodings are supported, including UTF-8 and UTF-16.
- Endpoints (USB only)
- Allows you to filter the data stream by USB endpoints.
In addition, the Raw Data View visualizer allows you to fine-tune the visual aspect of many features it displays. Bring up the context menu and select the Coloring… command. The following window appears.
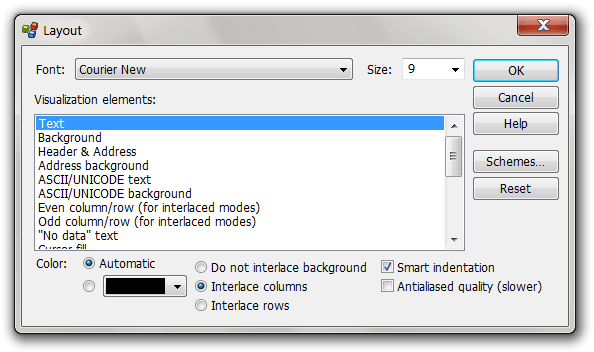
The following visualization elements are accessible for customization:
- Text
- Foreground color of all text.
- Background
- Background color of all text.
- Address
- Foreground color of address area.
- Address background
- Background color of address area.
- ASCII/UNICODE text
- Foreground color of text pane.
- ASCII/UNICODE background
- Background color of text pane.
- Even column/row background (for interlaced modes)
- Background color for column/row interlaced mode
- Odd column/row background (for interlaced modes)
- Background color for column/row interlaced mode
- “No data” text
- Foreground color of the area after the last monitored byte.
- Cursor fill
- Background color of the cursor.
- Cursor outline
- Cursor's outline color.
- Active row & column highlight text
- Foreground color of a highlighted cell.
- Active row & column highlight background
- Background color of a highlighted cell.
- Odd packet text
- Foreground color of an odd packet if packet interlacing mode is on.
- Odd packet background
- Background color of an odd packet if packet interlacing mode is on.
- Odd packet outline
- Outline color of an odd packet if packet interlacing mode is on.
- Even packet text
- Foreground color of an even packet if packet interlacing mode is on.
- Even packet background
- Background color of an even packet if packet interlacing mode is on.
- Even packet outline
- Outline color of an even packet if packet interlacing mode is on.
- Selection
- Background color of a selection.
Some of these elements allow you to select “Automatic” option. In this case, they will either use the color from another related element, or use operating system default color.
The following options are also configurable through the Layout Dialog:
- Packet interlacing
- You may choose to interlace rows, colors or do not interlace at all.
- Smart indentation
- More visually appealing indentation is applied in some group modes when this setting is on.
- Antialiased quality
- Use Cleartype fonts to display visualizer data. If you enable this option, Device Monitoring Studio may require more processing resources.
You may save current settings as schemes to load them in the future. HHD Software also provides several schemes for you to choose.