Packet View
This visualizer window consists of two parts. The top part displays monitored packets in a table. For each packet, the following information is displayed:
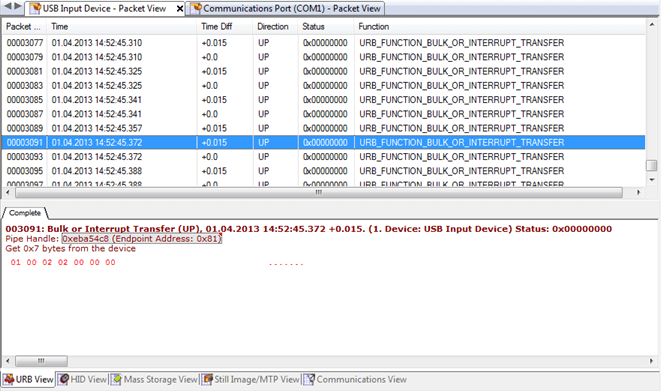
- Ordinal
- This is a consecutive packet number. This number is session-wide and will be the same in each session's visualizer.
- Time
- Packet Capture Time
- Time Diff
- Difference in seconds between the current packet and the previous packet. Note that the previous packet is the packet with a previous consecutive number. A previous packet may be missing in this and/or other data visualizer.
- Direction
- Can be either DOWN or UP. DOWN means that the packet is captured on its way down, that is, from controlling application through device's driver to USB host controller and finally, to device. UP means the opposite direction. Each packet is always captured twice: first on its way down and then on its way up. Default filtering settings may eventually hide one of these captures.
- Status
- Internal NT status code. Zero means success.
- Function
- Packet type
- Device
- For multi-source sessions, this column shows the ordinal number and name of the source device.
The bottom part is built from several visualizers, depending on session type. For USB, URB View, HID View, Mass Storage View, Still Image View and Communications View visualizers are present. For Serial, Request View, MODBUS View and PPP View visualizers are present. Click on any packet in the top part to see it decoded by each visualizer in the bottom part. Click on the tab to switch to the visualizer.
Packet View visualizer supports Generic Filtering platform.