Coloring Tab
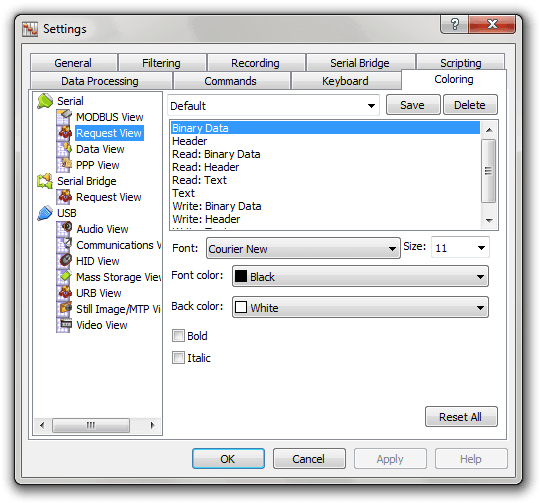
The list of all supported data visualizers is displayed on the left. Select a data visualizer to configure the appearance of its visual elements.
After you select a visualizer, you will see the list of all its visual elements on the right of the window. For each element, you can specify the font face, font size and style as well as foreground and background color.
Working with Schemes
A scheme is a collection of all appearance settings for a given visualizer. You can select the scheme from the combobox at the top of the page. A scheme named “Default” is automatically created for every data visualizer and allows you to quickly return to the original appearance settings.
You can create your own schemes. To create a scheme, type the scheme name in the combobox and press the Save button. To delete a scheme, select a scheme from the list and press the Delete button. Note that you cannot delete a built-in scheme.