General Tab
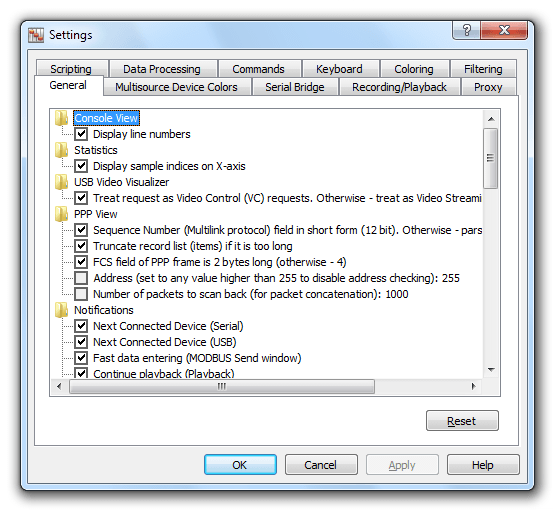
This configuration page allows you to set up general application properties. All properties are organized in the tree and can be either Boolean (on/off), selectable (one of) or numeric.
General Group
- Display splash screen on startup
- If enabled, a splash screen is displayed when Device Monitoring Studio is launched.
- Foreground downloading
- Device Monitoring Studio takes all available bandwidth when it downloads a new version.
- Define tooltip interval
- A number of millisecond a tooltip stays opened
- Save tools configuration with workspace
- If enabled, Tool window configuration (visibility and location) is saved into the workspace.
- Last recently used workspaces to display
- A number of last recently used workspaces to keep and display in the File menu.
- Display notification window for (seconds)
- A number of seconds a notification window is visible.
- Close affects the current tool window only
- If enabled and when close button is pressed on a stacked tool window frame, only the current tool window is closed, otherwise, the entire frame is closed.
- Restore main window position on startup
- If enabled, Device Monitoring Studio's main window position is automatically restored to its last position.
- Ask to save modified workspace
- If enabled and the current workspace has been modified, a user is asked to save the changes before closing Device Monitoring Studio.
- Check for updates
- Select how often Device Monitoring Studio checks whether a new version is available.
- Join consequent requests
- Automatically join consequent packets of the same type.
Notifications Group
This group contains the flags controlling the appearance of different notification windows.
Statistics Group
This group contains options related to Statistics visualizer.
- Display sample indices on X-axis
- Check this option to display the sample ordinal number on X-axis. Packet number and packet time are always displayed.
Raw Data View
- Display lowercase hexadecimal
- If enabled, all hexadecimal numbers use lowercase letters, otherwise they use uppercase.
- Display popup packet information
- Display detailed packet information when mouse is hovered on top of packet data.
Network Packet View
- Display popup packet information
- Display detailed packet information when mouse is hovered on top of packet data.
MODBUS
These options are used to control the legacy MODBUS View data visualizer.
- Truncate register/coil/request list if it is too long
- Automatically limit the number of items displayed.
- Add base offsets for registers, discrete inputs, etc.
- TBD
- Parse requests on WRITE (responses on READ) direction
- If enabled, MODBUS View data visualizer treats the current monitoring session as MODBUS Master, otherwise, it treats it as MODBUS Slave.
- Concatenate packets
- Automatically join split MODBUS packets.
- RTU mode
- If enabled, treat the current monitoring session as MODBUS RTU mode, otherwise treat it as MODBUS ASCII mode.
- Parse as hex
- Display all numbers in hexadecimal format.
Console View
This section contains options for Legacy Console View data visualizer.
- Display line numbers
- If enabled, line numbers are displayed in the data visualizer.
Scripting
- Reload scripts on startup
- If enabled, Device MMonitoring Studio automatically opens all previously opened script files.
- Ask to save unsaved scripts on close
- If enabled and there are unsaved scripts, a prompt is displayed to save the changes.
- Include scripting configuration into workspace
- If enabled, all opened scripts are saved into the workspace.
Serial Terminal
- Include terminal configuration into workspace
- If enabled, all running [terminal sessions] are saved into the workspace.
- Send text lines from file one by one
- If enabled, a text file is split into lines and they are subsequently sent to the serial session one by one. Otherwise, the entire text file is sent at once.
- Convert tab characters to N spaces
- If not equals to zero, tab characters are replaced with a given number of space characters when
TABkey is pressed in Serial Terminal Window. - Data block size
- A size of the buffer (in bytes) to use in serial terminal session.
USB Audio Visualizer
- Treat requests as Audio Control (AC) requests
- If enabled, requests are treated like Audio Control (AC) requests. Otherwise, they are treated like Audio Stream (AS) requests.
USB Video Visualizer
- Treat requests as Video Control (VC) requests
- If enabled, requests are treated like Video Control (VC) requests. Otherwise, they are treated like Video Stream (VS) requests.
PPP View
- Sequence number (Multilink protocol) field in short form (12 bit)
- Parse sequence number (Multilink protocol) field in short form (12 bit) if option is enabled, otherwise parse it in long form (24 bit).
- Truncate record list if it is too long
- Limit the number of records in the list.
- FCS field of PPP frame is 2 bytes long
- If enabled, FCS field of PPP frame is 2 bytes long, otherwise it is 4 bytes long.
- Address
- Set to the device address to automatically do address checking or any number higher than 255 to disable it.
- Number of packets to scan back
- A number of packets PPP View looks back in search for a starting packet.
Auto-Hide
- Hover time (ms)
- A number of milliseconds a mouse needs to be hovered over auto-hidden tool window to open it.
- Close time (ms)
- A number of milliseconds a tool window stays visible until it closes after the mouse leaves.